 |
The Open FUSION Toolkit 26.9
An open-source framework for fusion and plasma science and engineering
|
Loading...
Searching...
No Matches
|
The Open FUSION Toolkit 26.9
An open-source framework for fusion and plasma science and engineering
|
In this example we demonstrate how to compute Fourier transforms of the normal B field on an inner torus from a plasma filament drive, an outer torus, and a closed loop coil resembling a Runaway Electron Mitigation Coil (REMC).
To load the ThinCurr python module we need to tell python where to the module is located. This can be done either through the PYTHONPATH environment variable or within a script using sys.path.append() as below, where we look for the environement variable OFT_ROOTPATH to provide the path to where the OpenFUSIONToolkit is installed (/Applications/OFT for binaries on macOS).
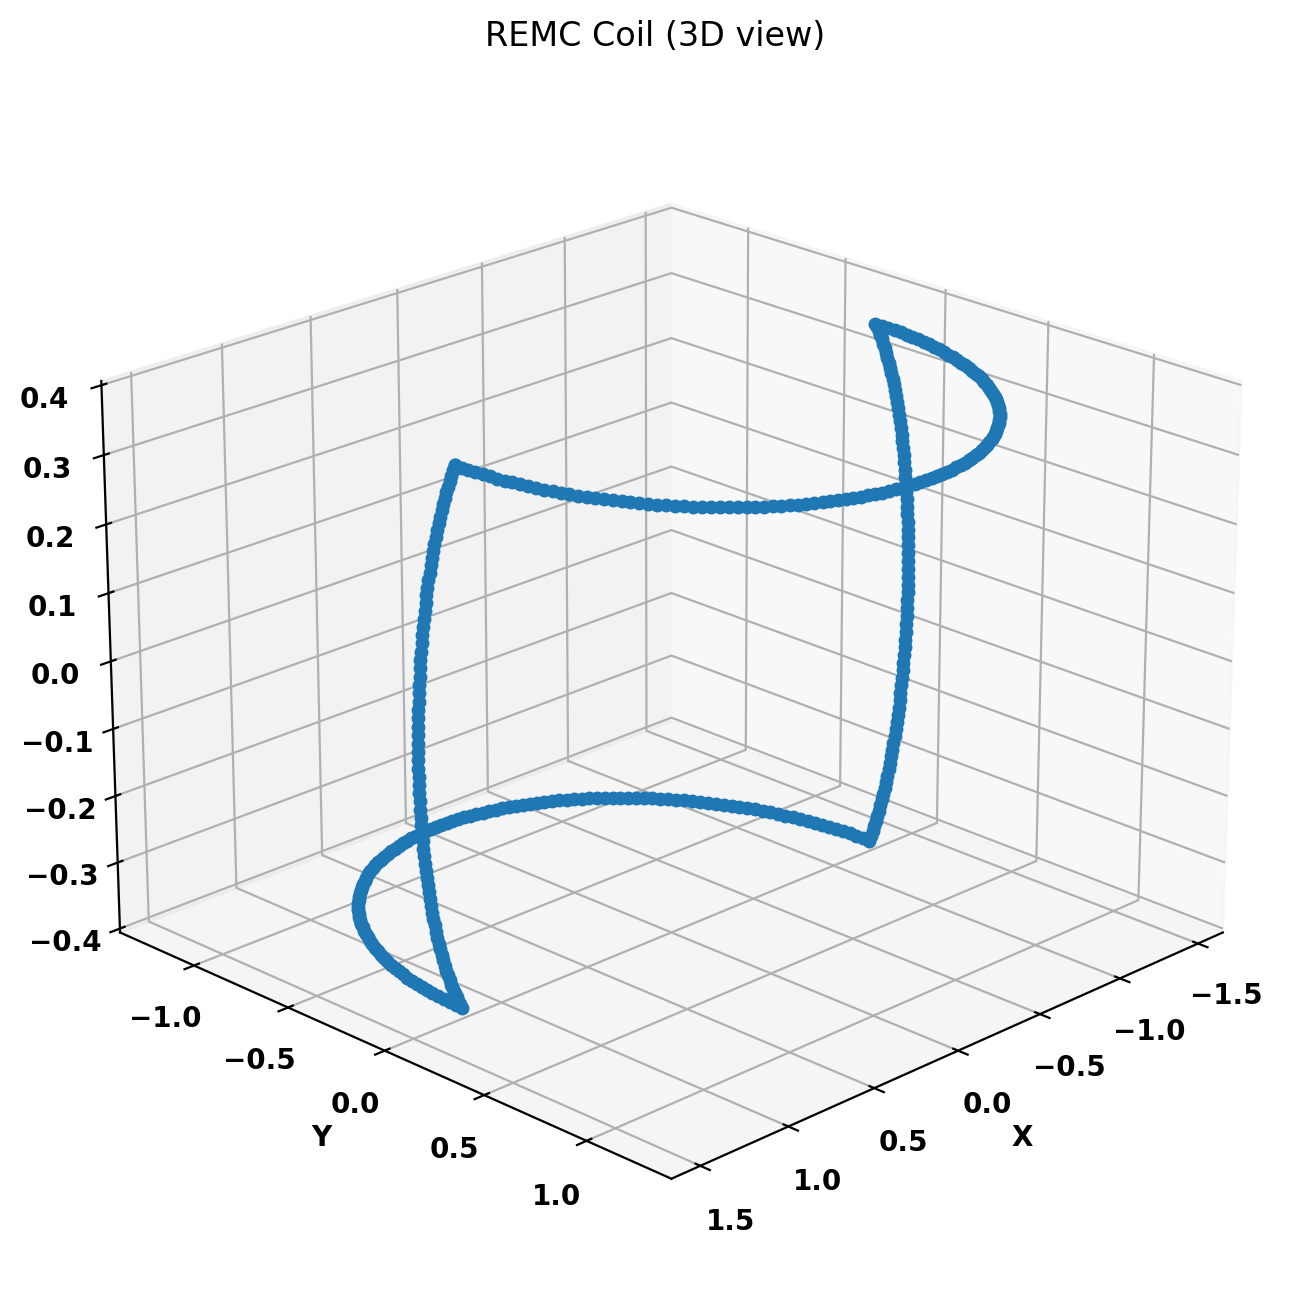
We now create a OFT_env instance for execution using four threads and a ThinCurr instance that utilizes that execution environment. Once created, we setup the model from an existing HDF5 and XML mesh definition using setup_model(). The XML file contains a plasma current filament on the magnetic axis (masked from sensor) and a closed-loop passive REMC coil plotted below.
We also initialize I/O for this model using setup_io() to enable output of plotting files for 3D visualization in VisIt, Paraview, or using pyvista.
#----------------------------------------------
             ____  ____________
            / __ \/ ____/_  __/
           / / / / /_    / /
          / /_/ / __/   / /
          \____/_/     /_/

Base release:        v1.0.0-beta7
Development branch:  release_26_06
Revision id:         978c4b9f

Parallelization Info:
  Not compiled with MPI
  # of OpenMP threads =    4

Linear Algebra backend: native

#----------------------------------------------


Creating thin-wall model
  Loading V(t) driver coils
    Masked      0 coils from sensors
  Loading I(t) driver coils
    Masked      1 coils from sensors
  Building holes

  Loading region surface resistivity:
     1  1.2566E-04

  Setup complete:
    # of points    =         2394
    # of edges     =         7182
    # of cells     =         4788
    # of holes     =            2
    # of closures  =            0
    # of Vcoils    =            1
    # of Icoils    =            1
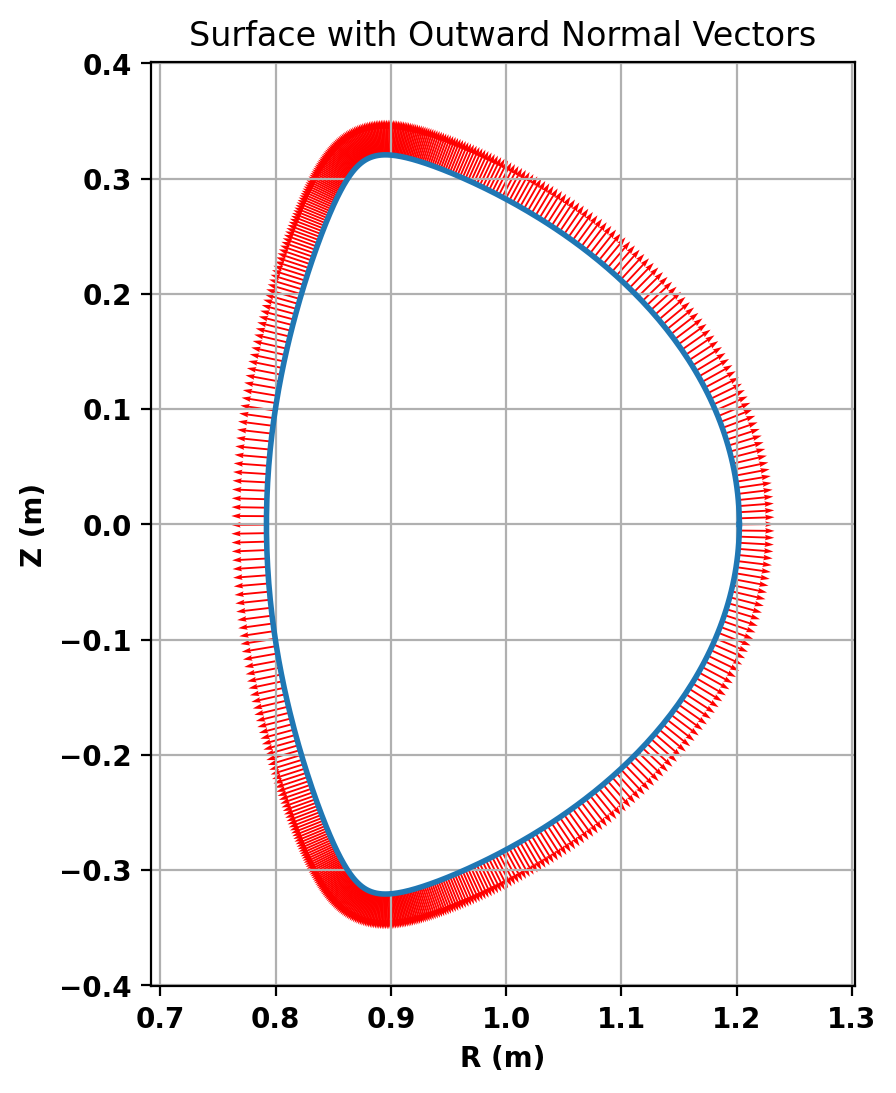
torus_fourier_sensor toroidally extends the definition of a poloidal cross section into a torus, and it places Mirnov sensors measuring outward normal magnetic fields on the torus's surface. Here we initalize an instance of the class by first providing a major radius (for calculating outward normal vector) and a cross section (R,Z) definition calculated by GPEC (or specifically, by DCON's truncation) using a synthetic TokaMaker equilibrium that fits within a R=1, a=0.5 torus. The equilibrium asserts that the magnetic field on axis is in the same direction as the plasma current (by definition helicity = 1).
Important Note: For coupling with GPEC and for running Fourier analysis in Hamada coordinates, the cross section used should be defined by the control surface calculated by GPEC and that hamada_dphi has to be provided to the Fourier analysis functions whenever possible. You can find the control surface definition and hamada_dphi (corresponding to delta_phi) in the gpec_control_output_nX_nc output tree of OMFIT GPEC once you've run a non-kinetic GPEC using the corresponding equilibrium. Check out OMFIT GPEC tutorial for more.
Before running the main calculations we will also define some sensors to measure the magnetic field. In ThinCurr all sensors measure the flux passing through a 3D path of points, but there are several helper classes to define common sensors (eg. Poloidal flux and Mirnovs). Here, the torus_fourier_sensorinstance calculates outward normal vectors places on the poloidal cross section, places Mirnov sensors on them, and replicate the sensor surface toroidally. save_sensors() is then used to save the resulting sensor for later use, specifically the ThinCur model we created.
With the model setup, we can now compute the inductance and resistivity matrices. A numpy version of the self-inductance matrix will be stored at tw_plate.Lmat. By default the resistivity matrix is not moved to python as it is sparse and converting to dense representation would require an increase in memory. These matrices correspond to the \(\textrm{L}\) and \(\textrm{R}\) matrices for the physical system
\(\textrm{L} \frac{\partial I}{\partial t} + \textrm{R} I = V\)
Loading sensor information
  Loading flux loops from file: floops.loc
    # of floops =
 ␞
Building element->sensor inductance matrix
  Time =  1s
Building coil->sensor inductance matrix
  Time =  0s
Building coil<->element inductance matrices
  Time =  0s
Building coil<->coil inductance matrix
  Time =  0s
  Vcoil    1: L [H] =   1.3655E-05
 Partitioning grid for block low rank compressed operators
   nBlocks =                   2
   Avg block size =         1196
   # of SVD =                  1
   # of ACA =                  0

 Building block low rank inductance operator
   Building hole and Vcoil columns
   Reading HODLR matrix from file: HODLR_L.save
   Building diagonal blocks
     50%
     60%
     70%
     80%
     90%
   Building off-diagonal blocks using ACA+
     Compression ratio:  62.1%  ( 3.56E+06/ 5.73E+06)
     Time =  0s
Building resistivity matrix
  Vcoil    1: R [Ohm] =   2.1032E-03
With the model fully defined we can now use run_td() to perform a time-domain simulation. In this case we simulate 40 ms using a timestep of 0.2 ms (200 steps). We also specify the current in the single I-coil defined in the XML input file as a function of time (coil_currs), where the first column specifies time points in ascending order and the remaining columns specify coil currents at each time point.
Starting time-domain simulation
  timestep    time           sol_norm     nits    solver time
      10    2.000000E-03    1.3833E+01      20        0.02
      20    4.000000E-03    2.1946E+01      21        0.03
      30    6.000000E-03    1.3662E+01      20        0.02
      40    8.000000E-03    8.6930E+00      20        0.02
      50    1.000000E-02    5.7298E+00      17        0.02
      60    1.200000E-02    3.8920E+00      17        0.02
      70    1.400000E-02    2.7128E+00      18        0.02
      80    1.600000E-02    1.9320E+00      18        0.02
      90    1.800000E-02    1.4011E+00      11        0.01
     100    2.000000E-02    1.0324E+00      14        0.02
     110    2.200000E-02    7.6840E-01       7        0.01
     120    2.400000E-02    5.7945E-01       7        0.01
     130    2.600000E-02    4.4085E-01       7        0.01
     140    2.800000E-02    3.3580E-01       7        0.01
     150    3.000000E-02    2.5734E-01       7        0.01
     160    3.200000E-02    1.9855E-01       7        0.01
     170    3.400000E-02    1.5364E-01       6        0.01
     180    3.600000E-02    1.1892E-01       4        0.01
     190    3.800000E-02    9.1946E-02       6        0.01
     200    4.000000E-02    7.1229E-02       5        0.01
 Building block low rank magnetic field operator
   Building hole and Vcoil columns
   Reading HODLR matrix from file: HODLR_B.save
   Building diagonal blocks
     50%
     60%
     70%
     80%
     90%
   Building off-diagonal blocks using ACA+
     Compression ratio:  63.2%  ( 1.09E+07/ 1.72E+07)
     Time =  0s
Post-processing time-domain simulation

Creating output files: oft_xdmf.XXXX.h5
  Removing old Xdmf files
    Removed 0 files
  Found Group: thincurr
    Found Mesh: icoils
    Found Mesh: smesh
    Found Mesh: vcoils
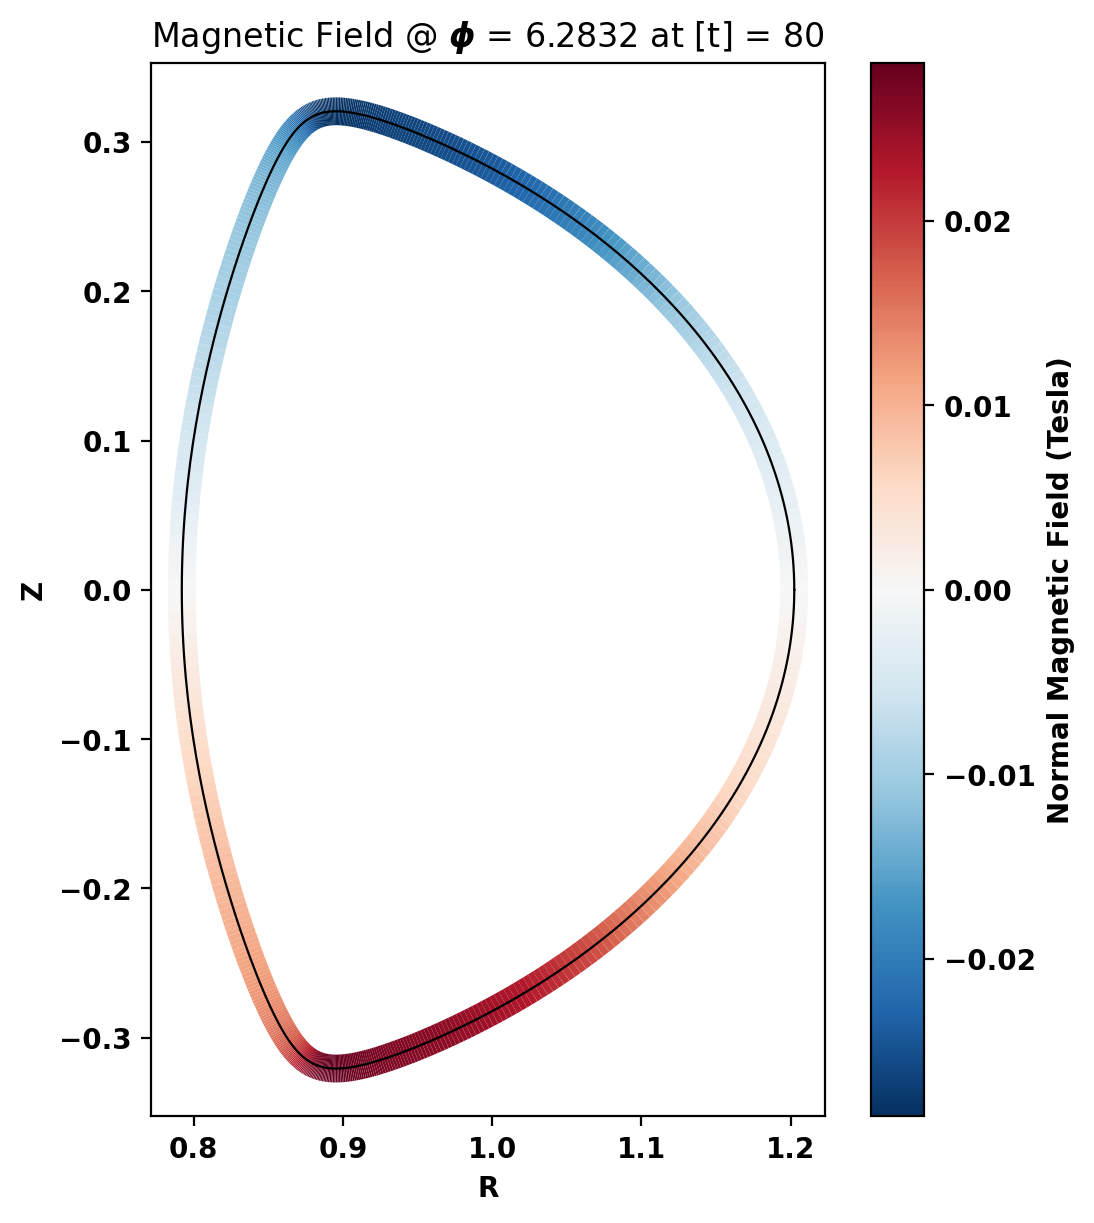
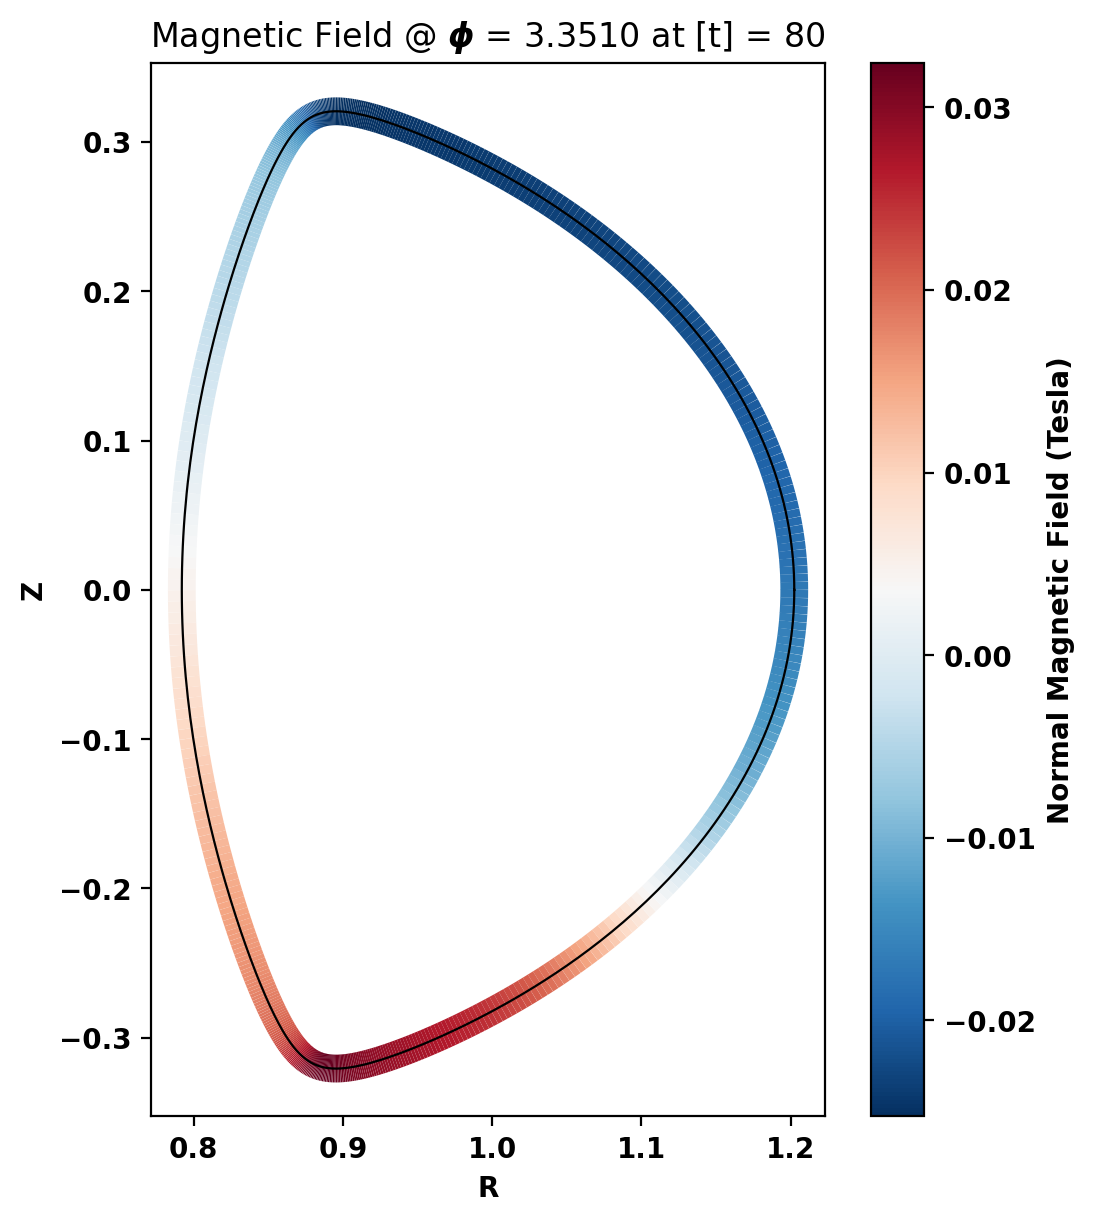
The first two plots are raw signal mesh and the inverse Fourier transform of the Fourier transform of the raw mesh–evidently they should match if the code works properly. The last plot is simply the information of the first at phi=0 plotted as a 2D line graph.
We can notice the effect of REMC from the change in signal strength around phi=2.8 and 5.7.
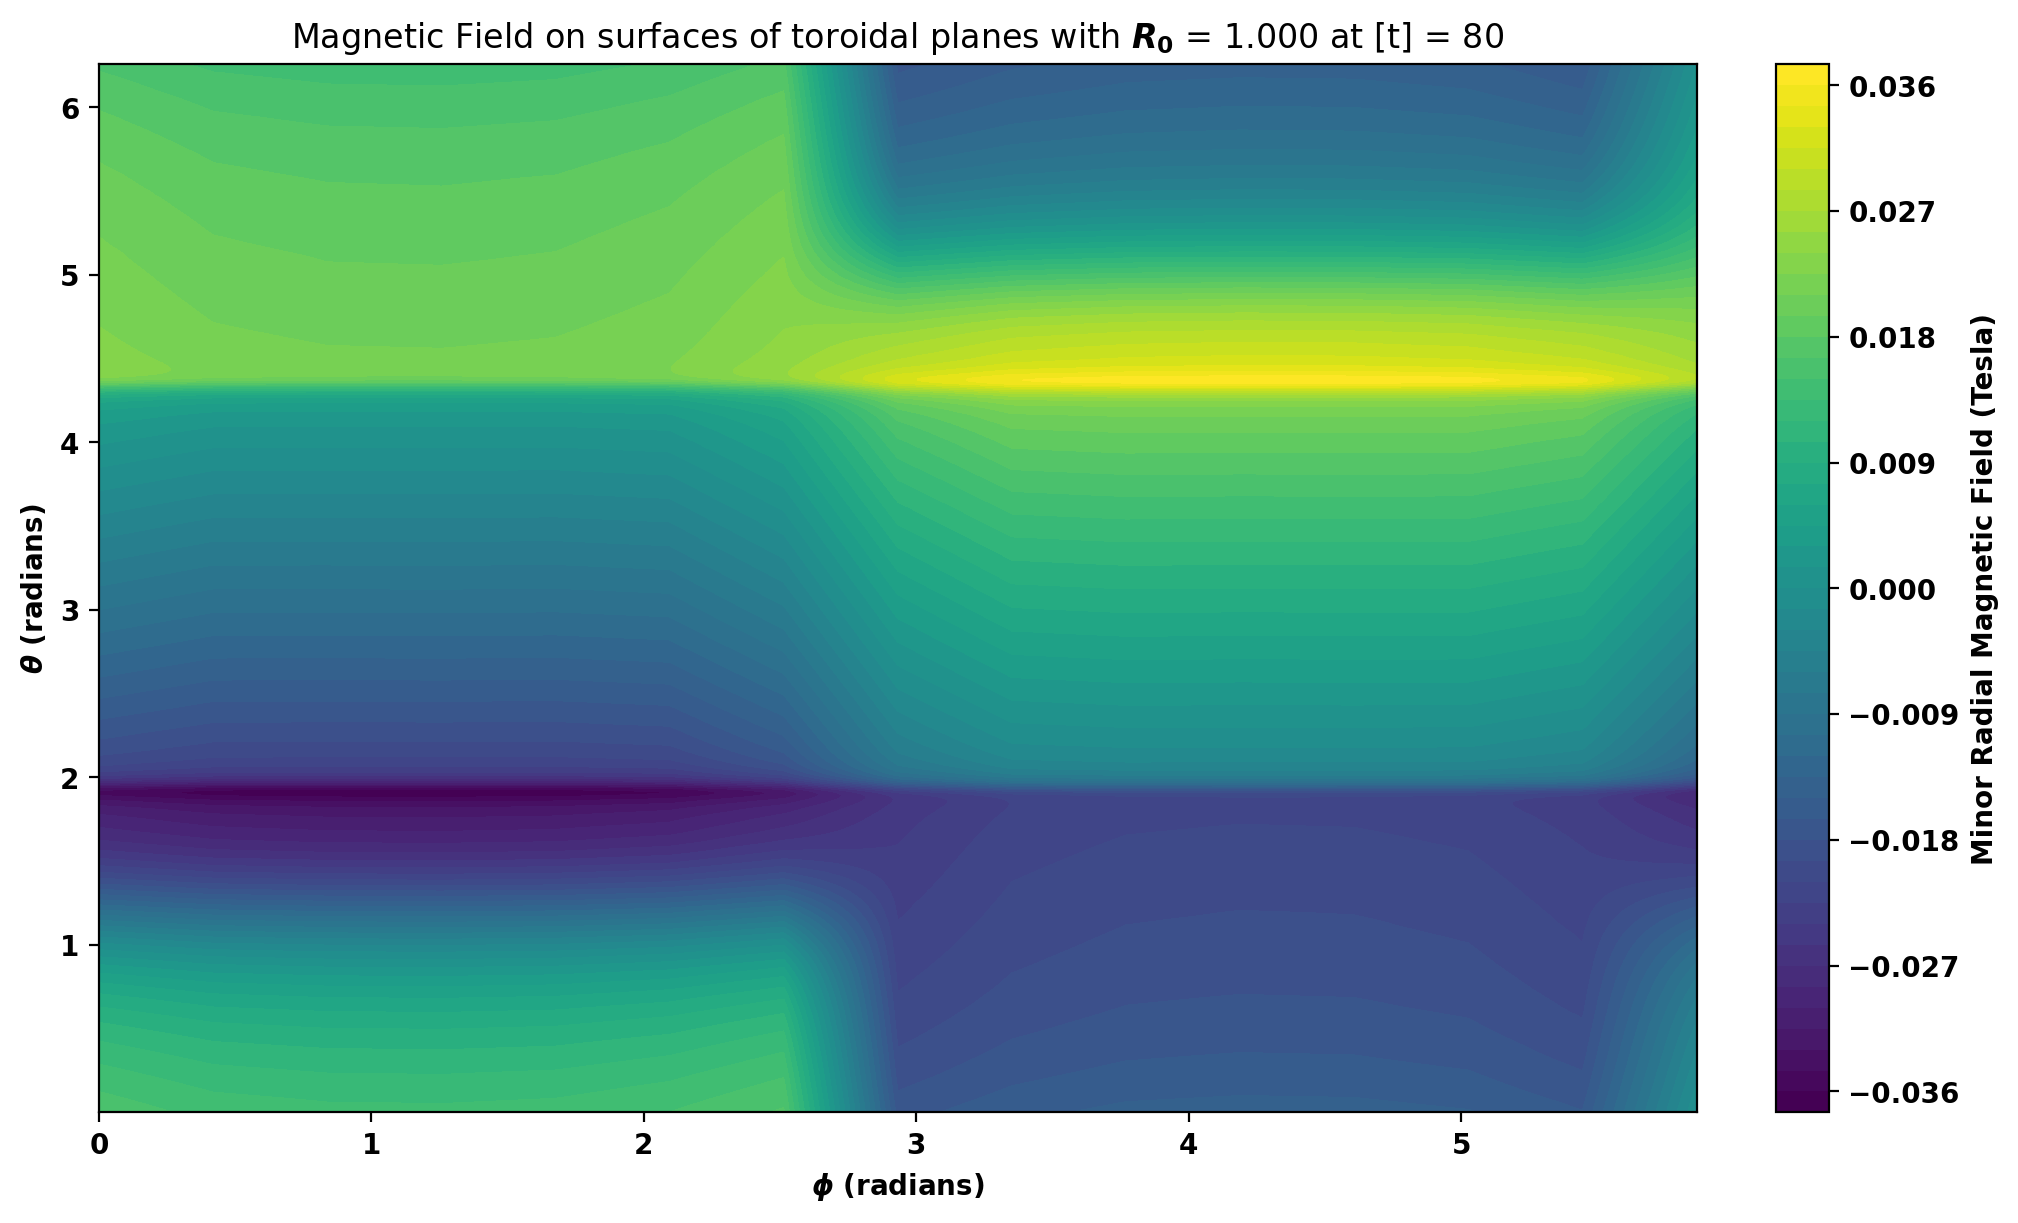
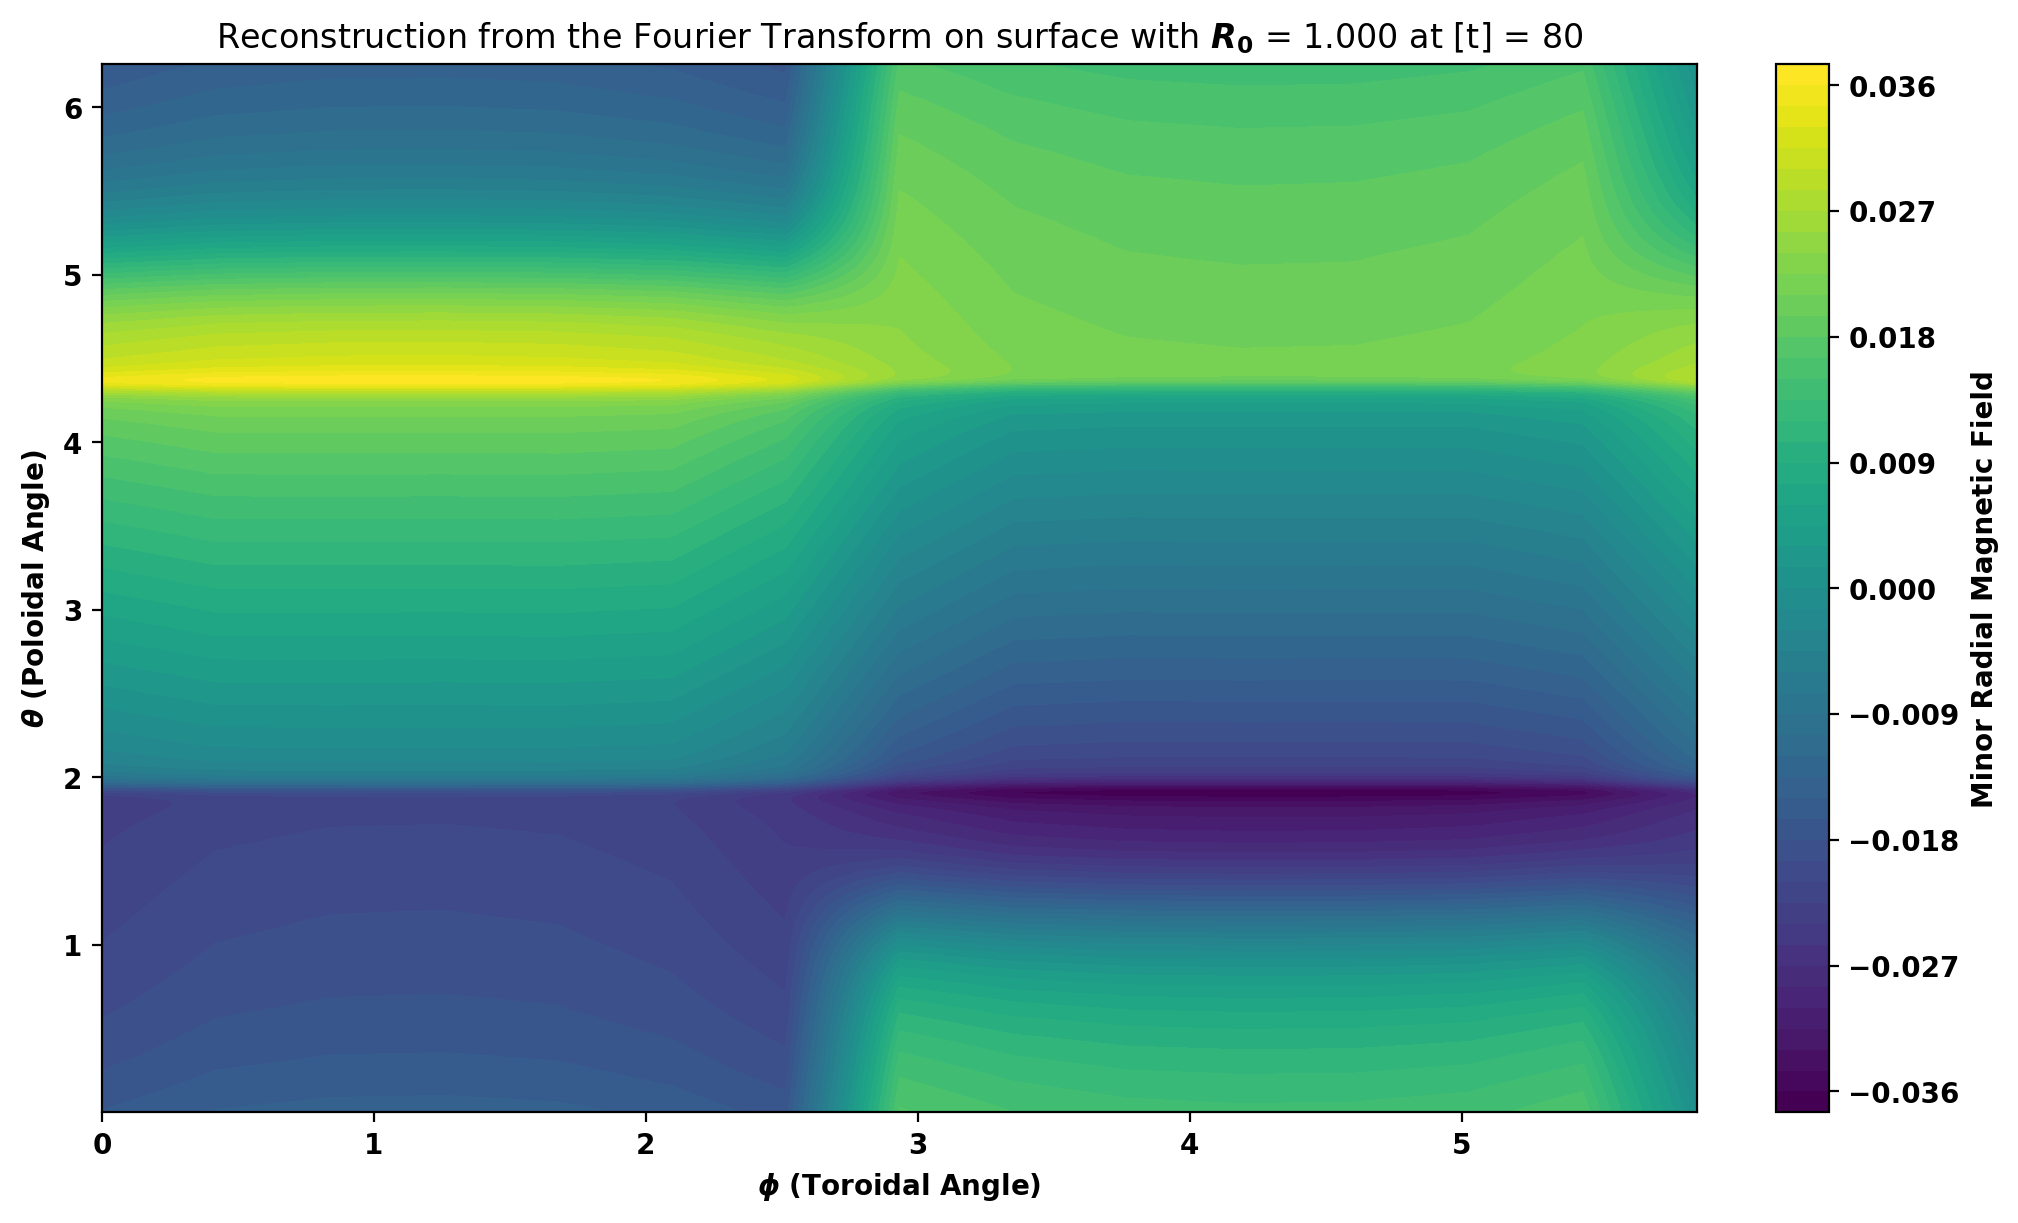
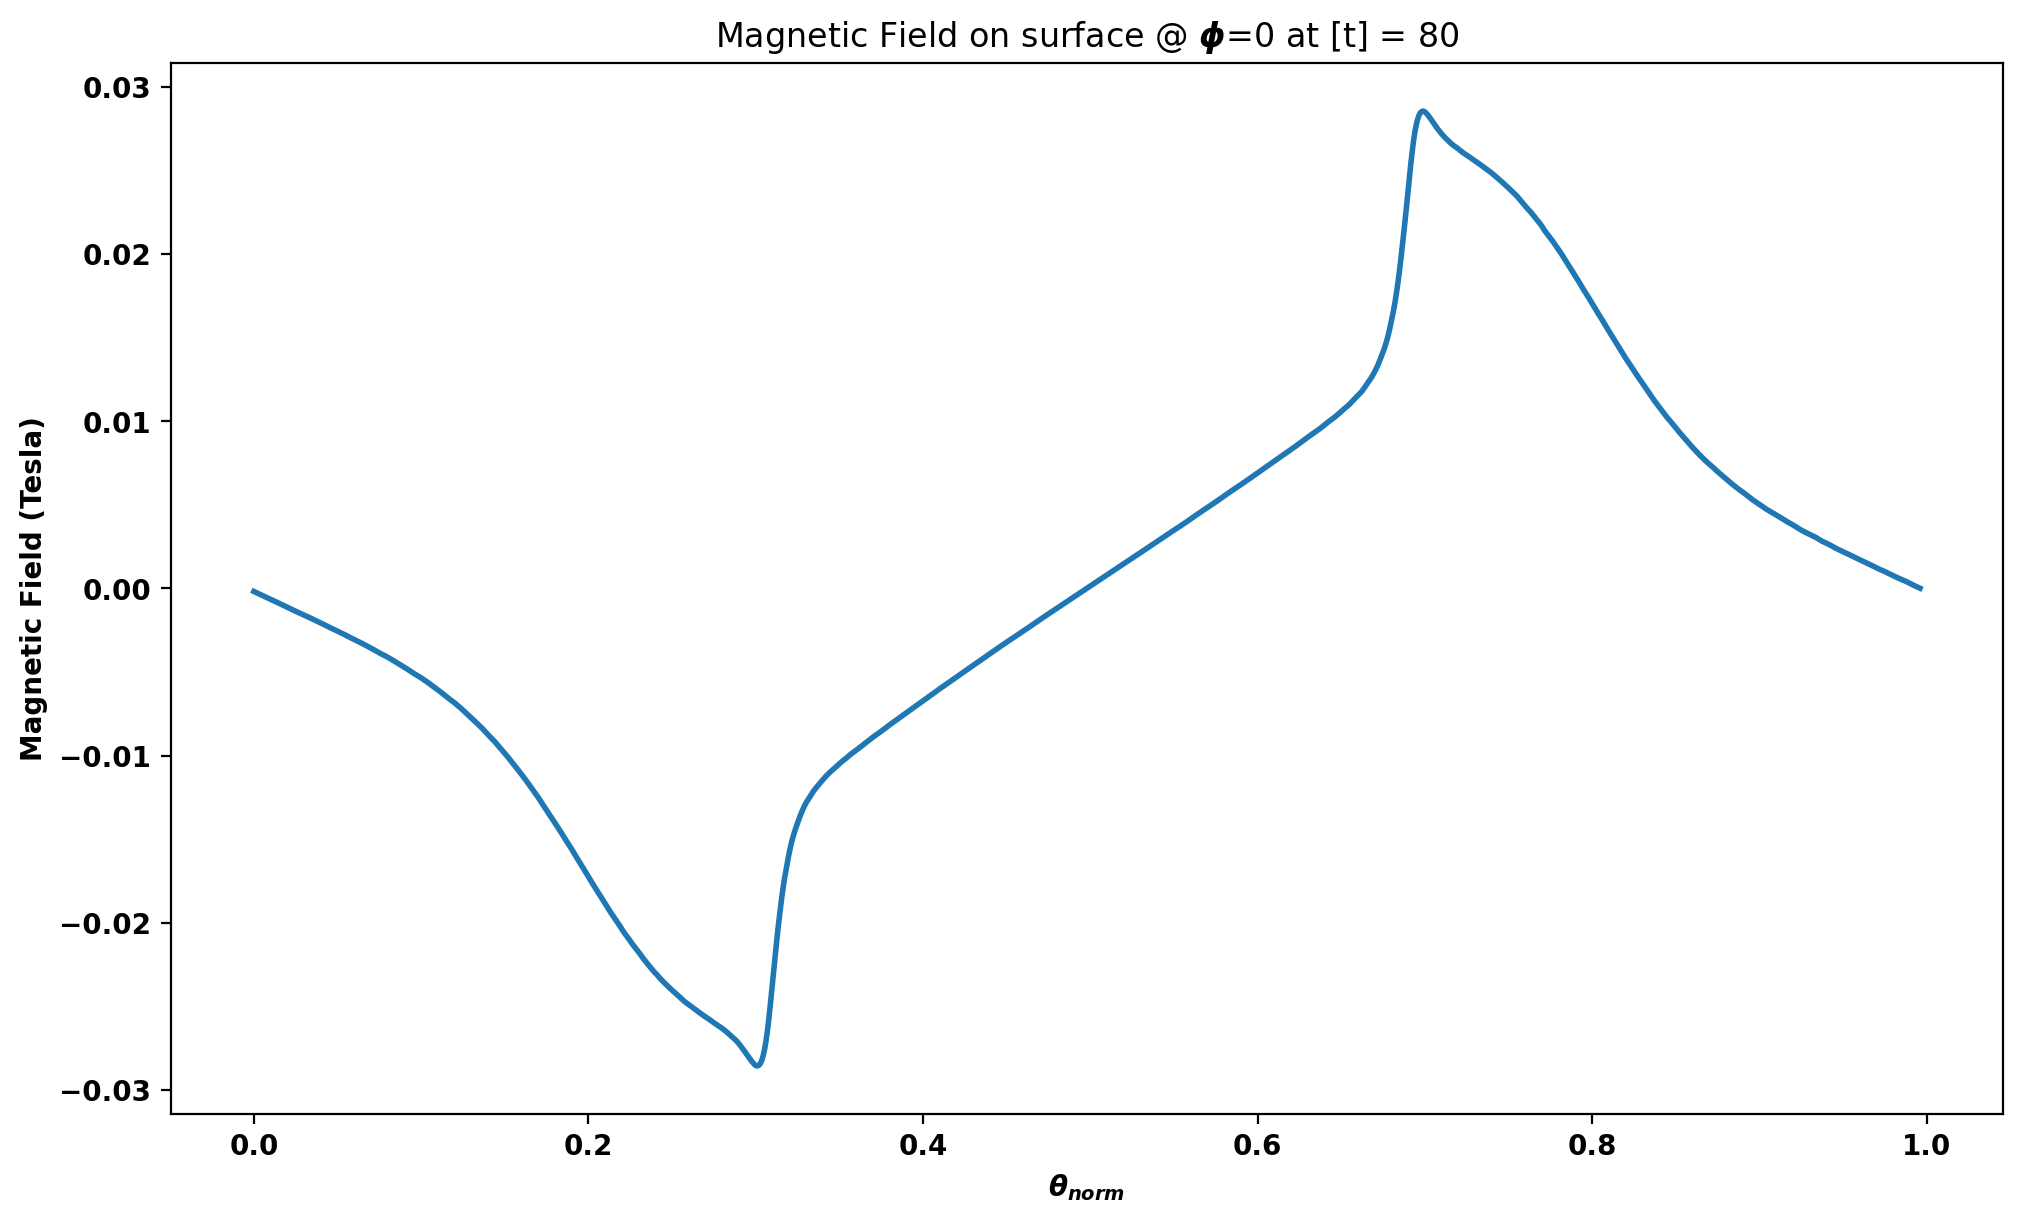
Here are two plots showing the outward normal magnetic fields on two different poloidal cross sections.
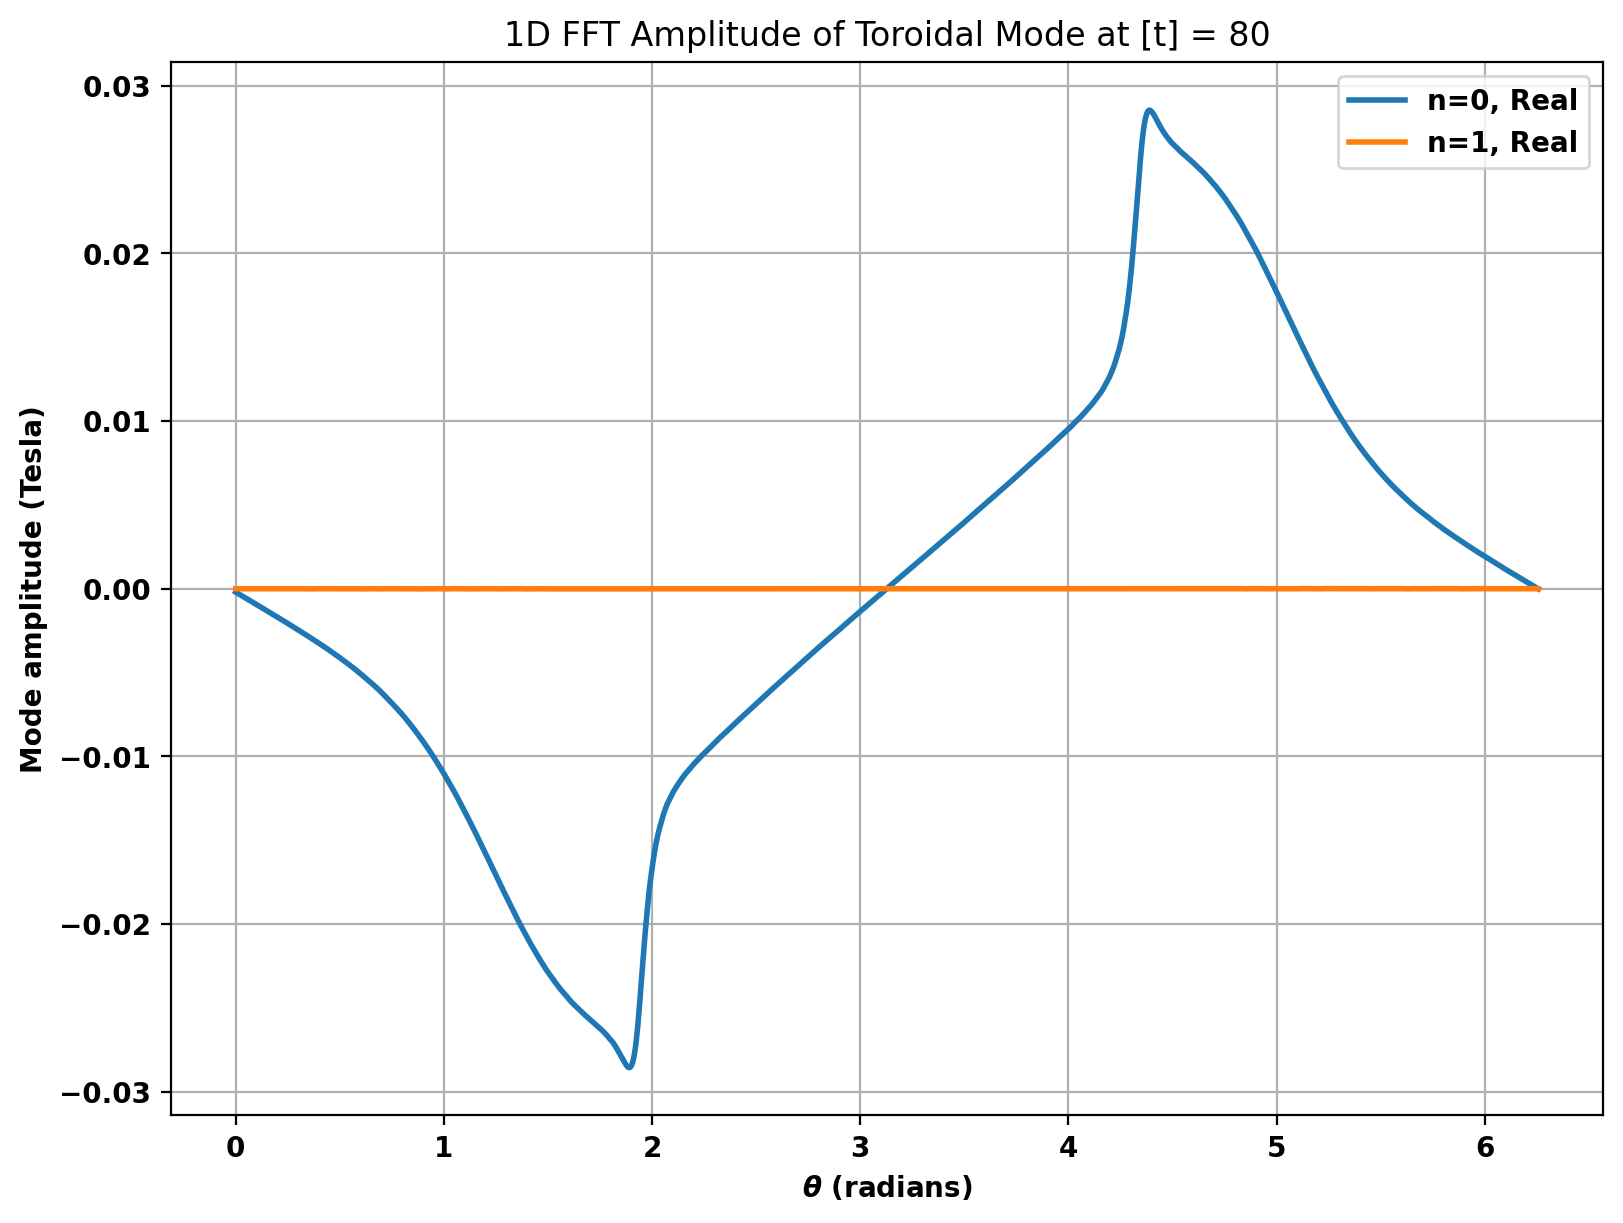
Next are two plotting functions in which 1D Fast Fourier Transform is performed on the axis specified (poloidal = 0, toroidal = 1). They only differ in the part of the Fourier amplitudes shown.
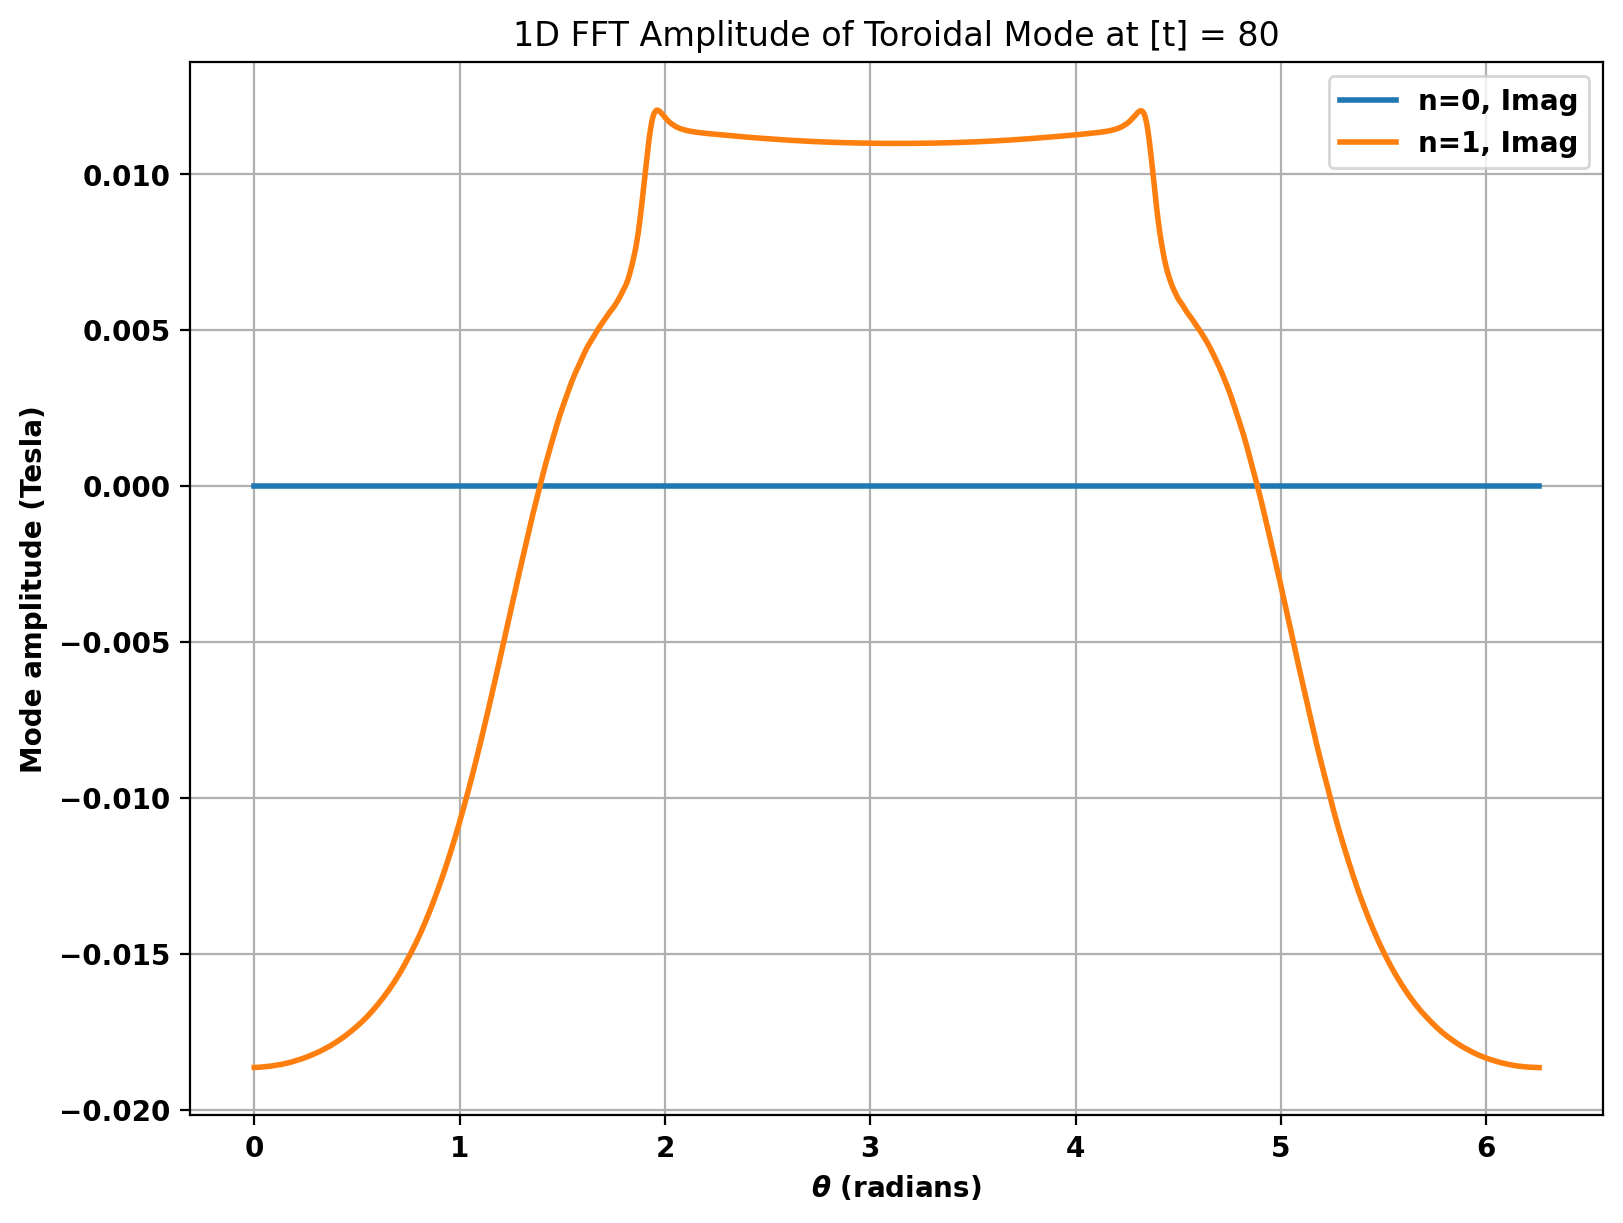
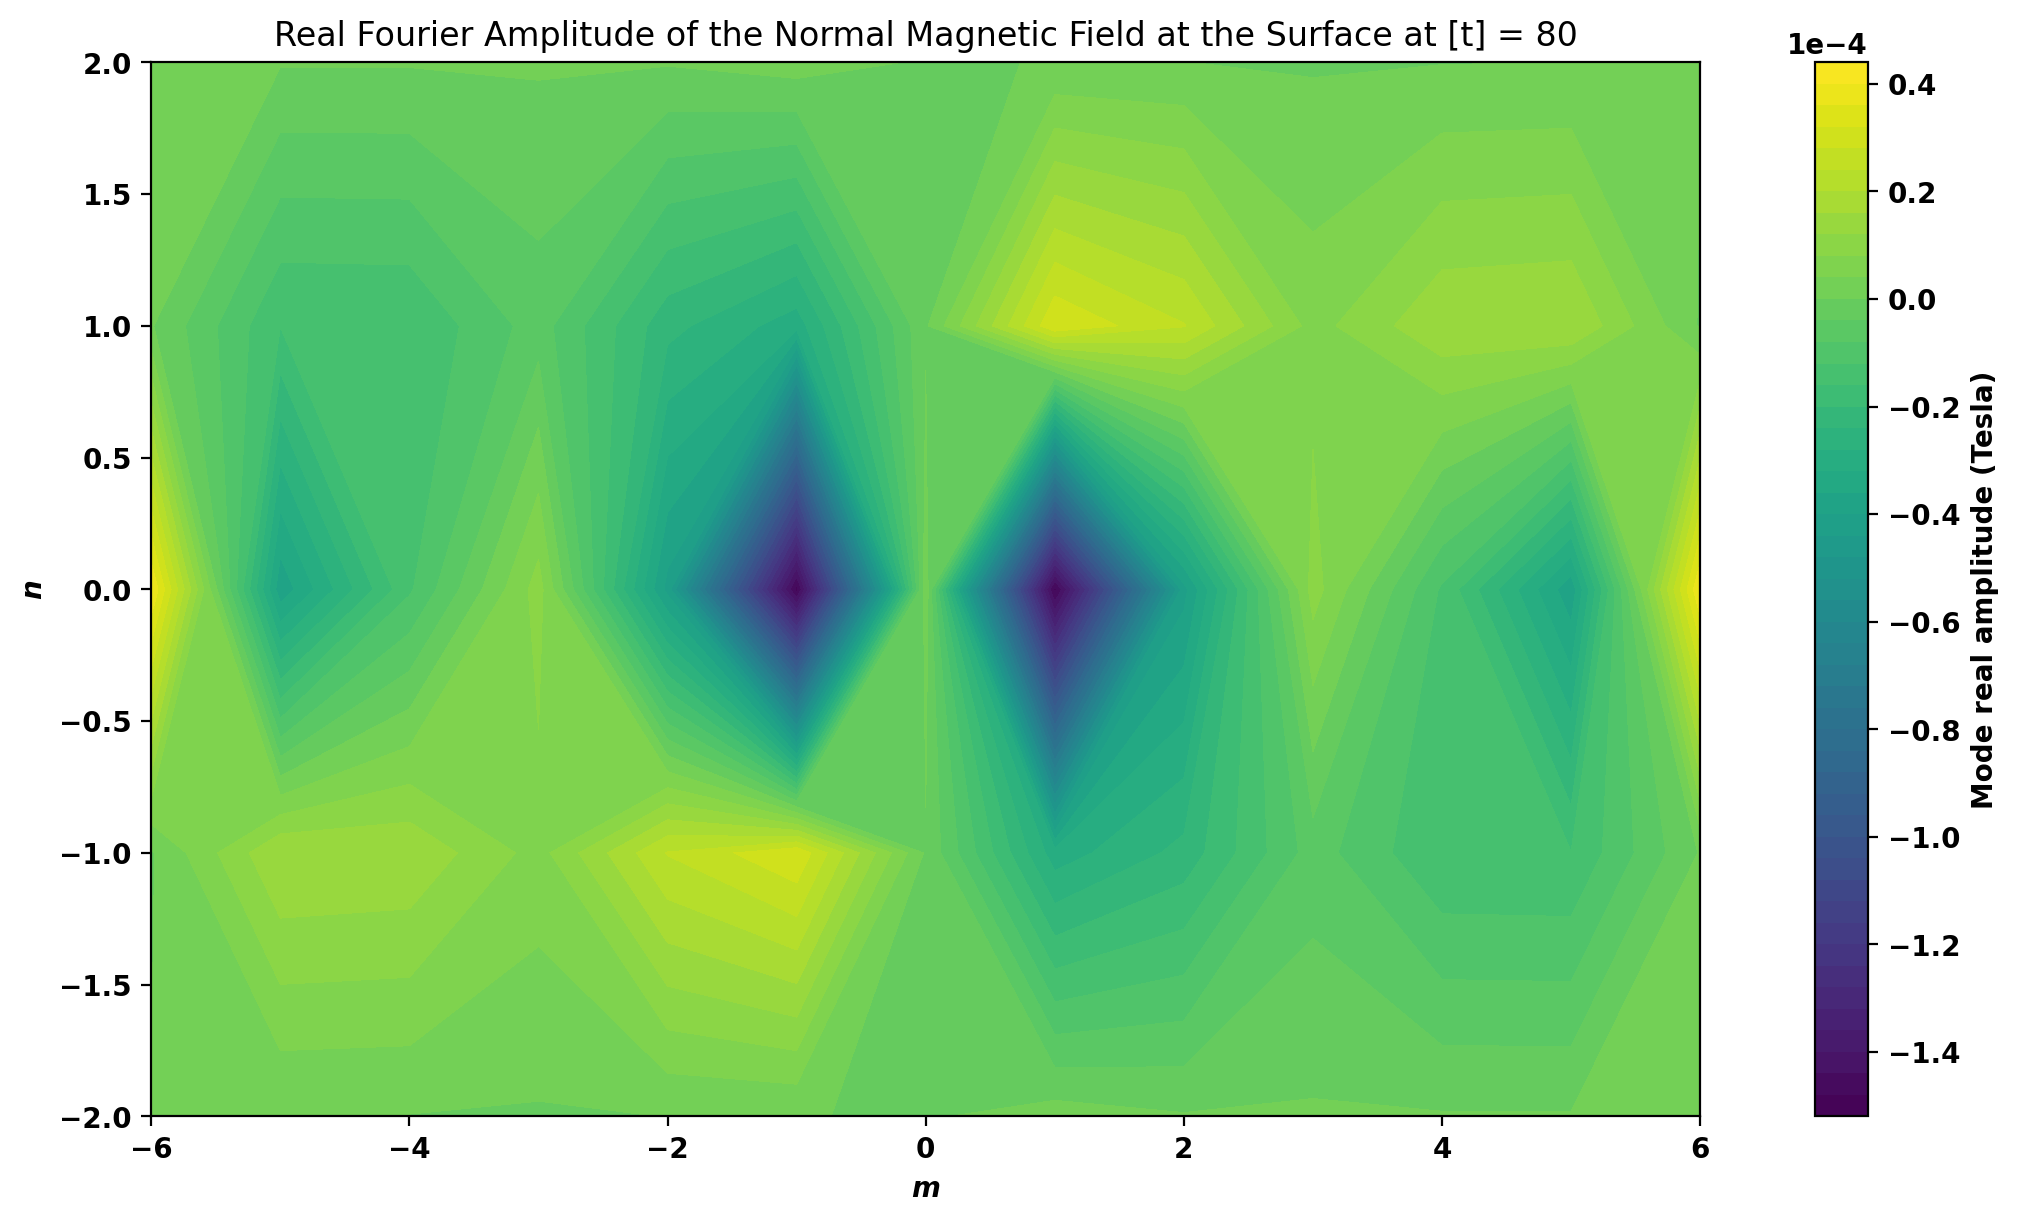
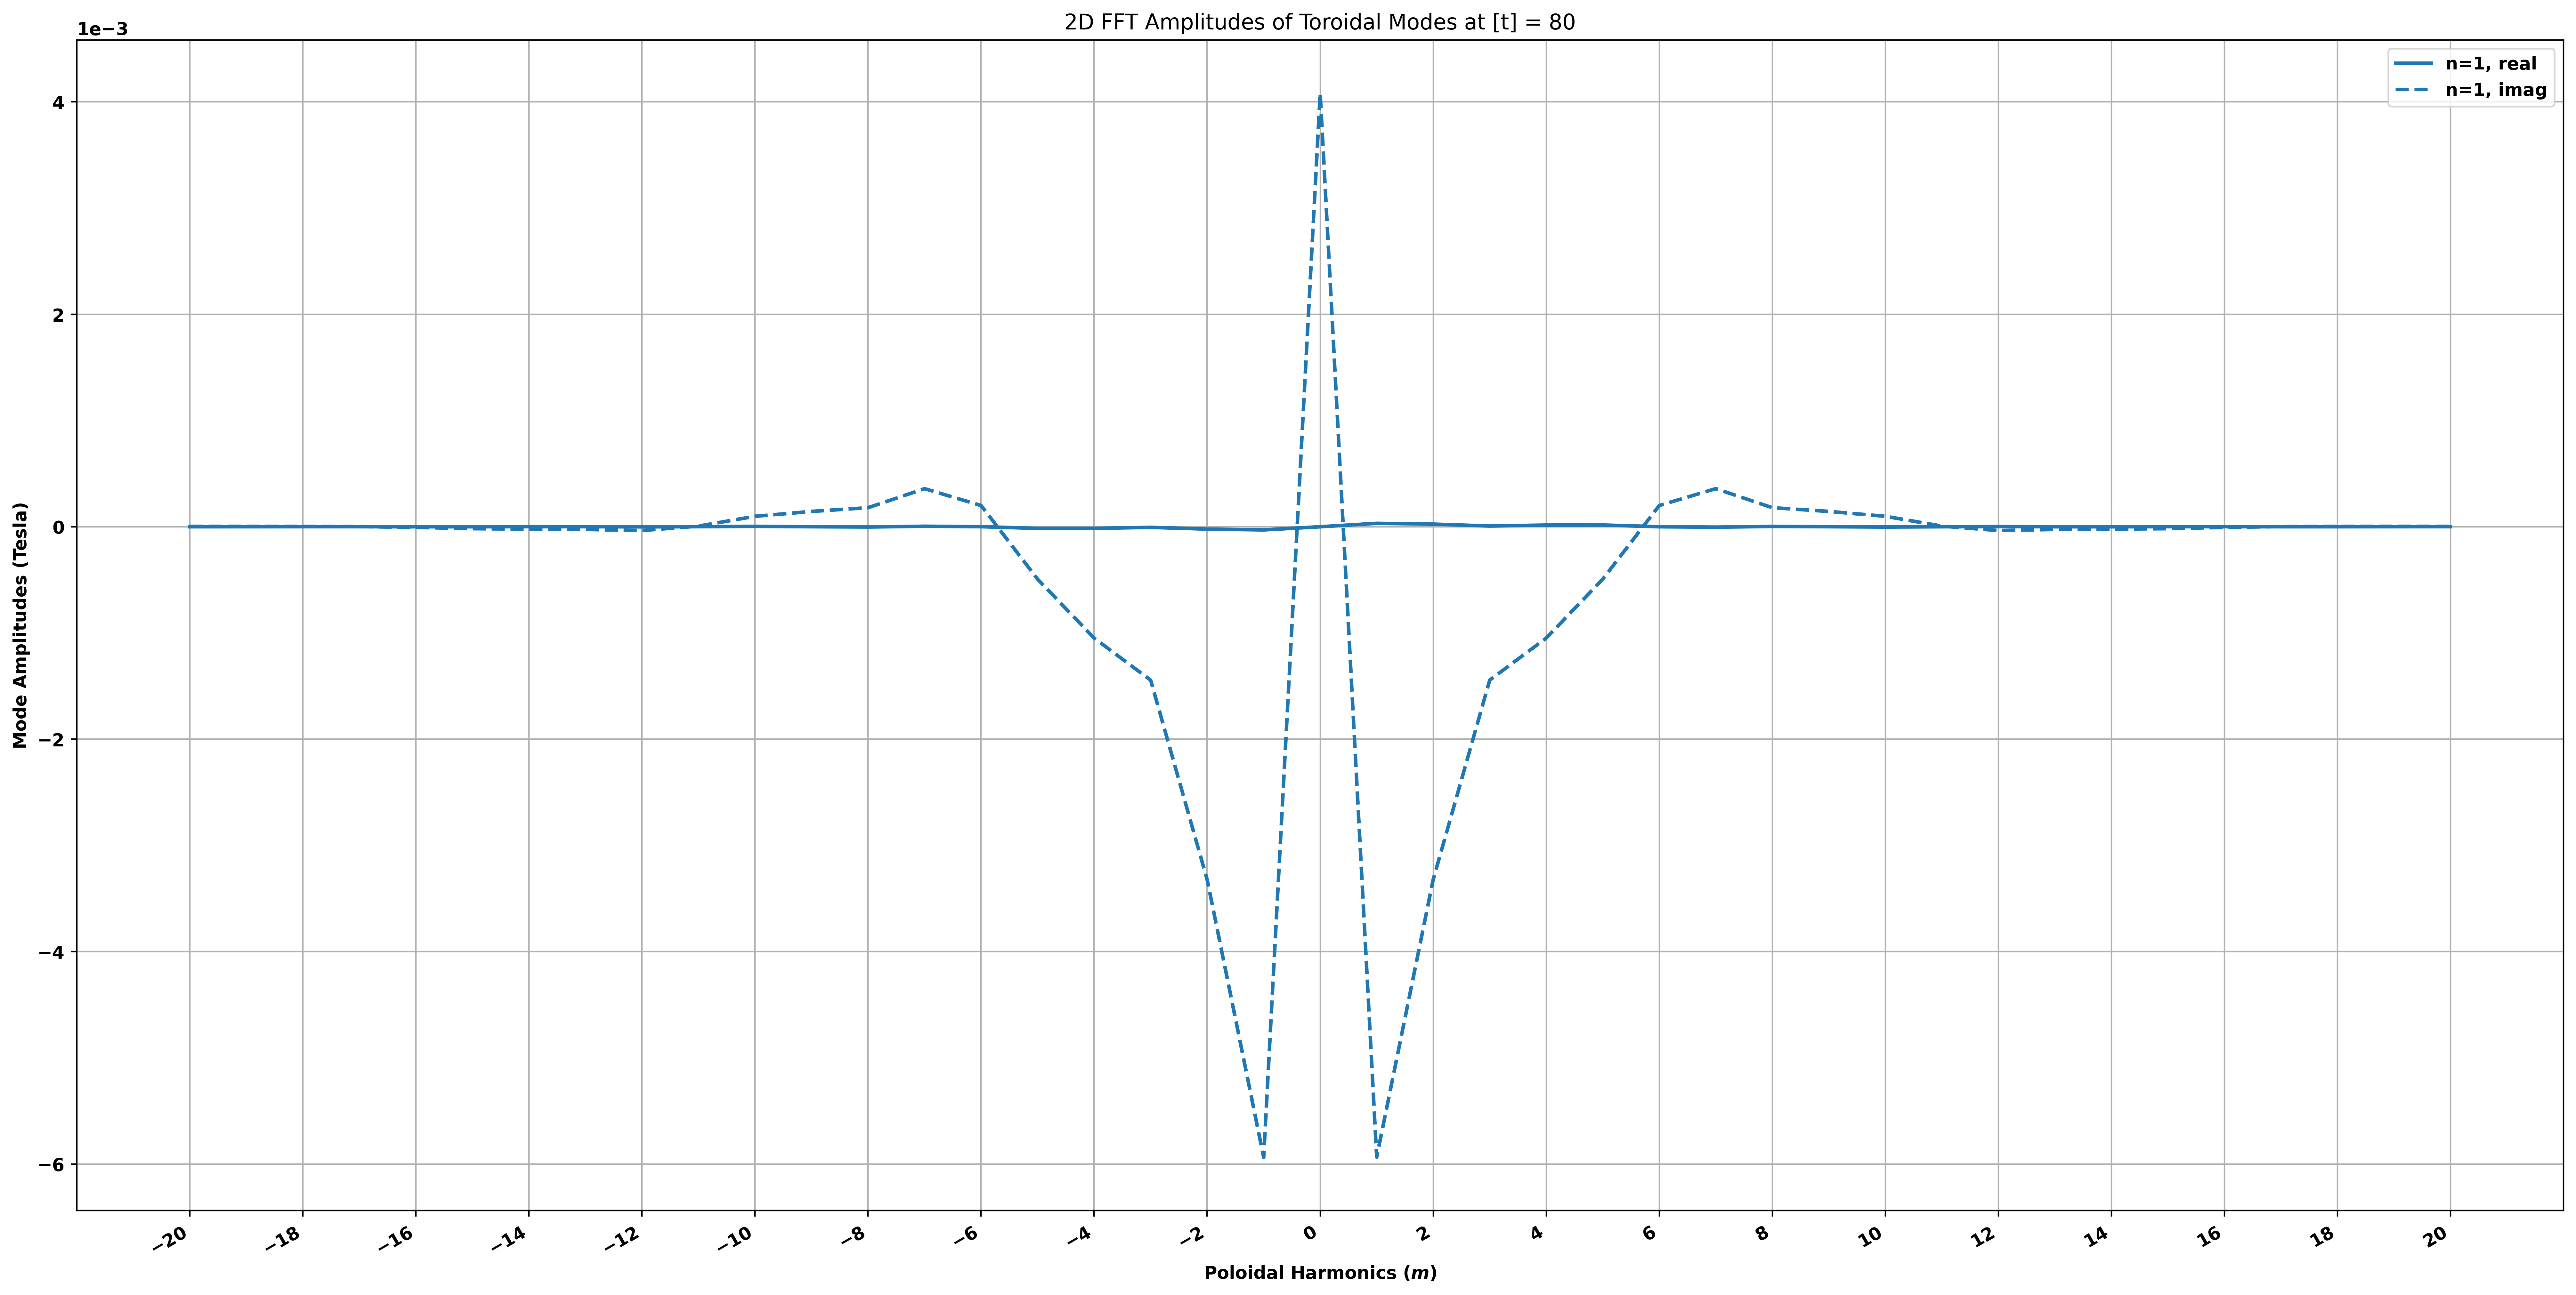
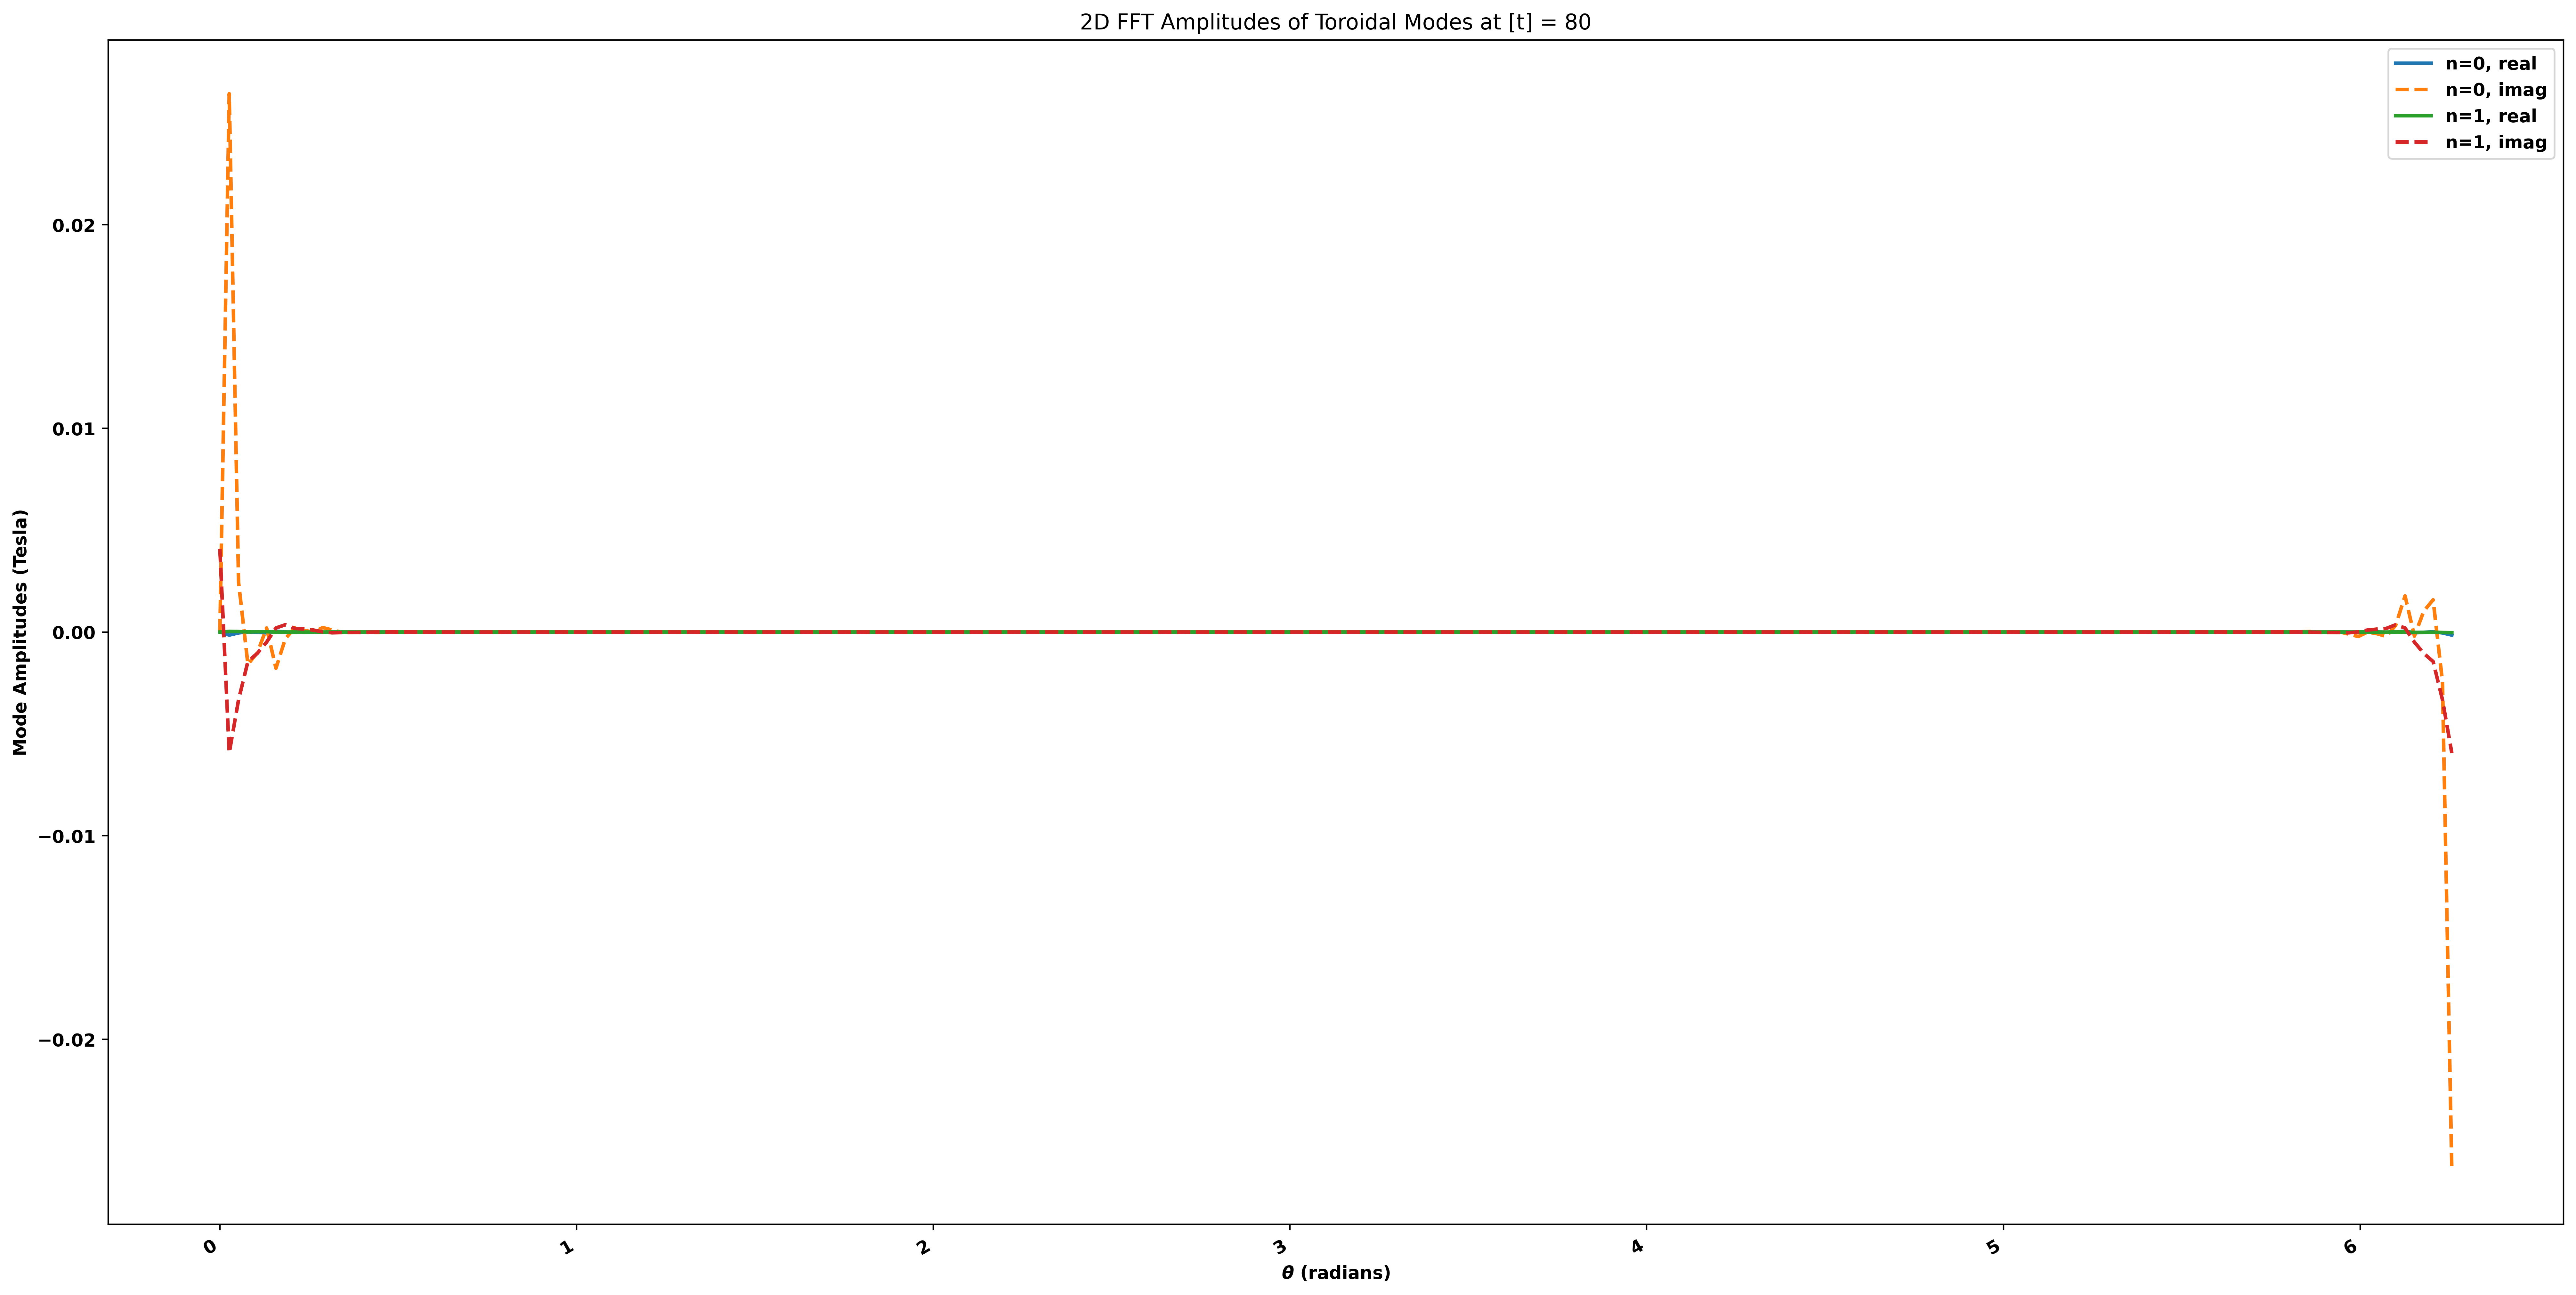
Finally, we can perform 2D Fast Fourier Transform on the sensor signal mesh through these plotting methods, and there are various ways we can visualize the results.
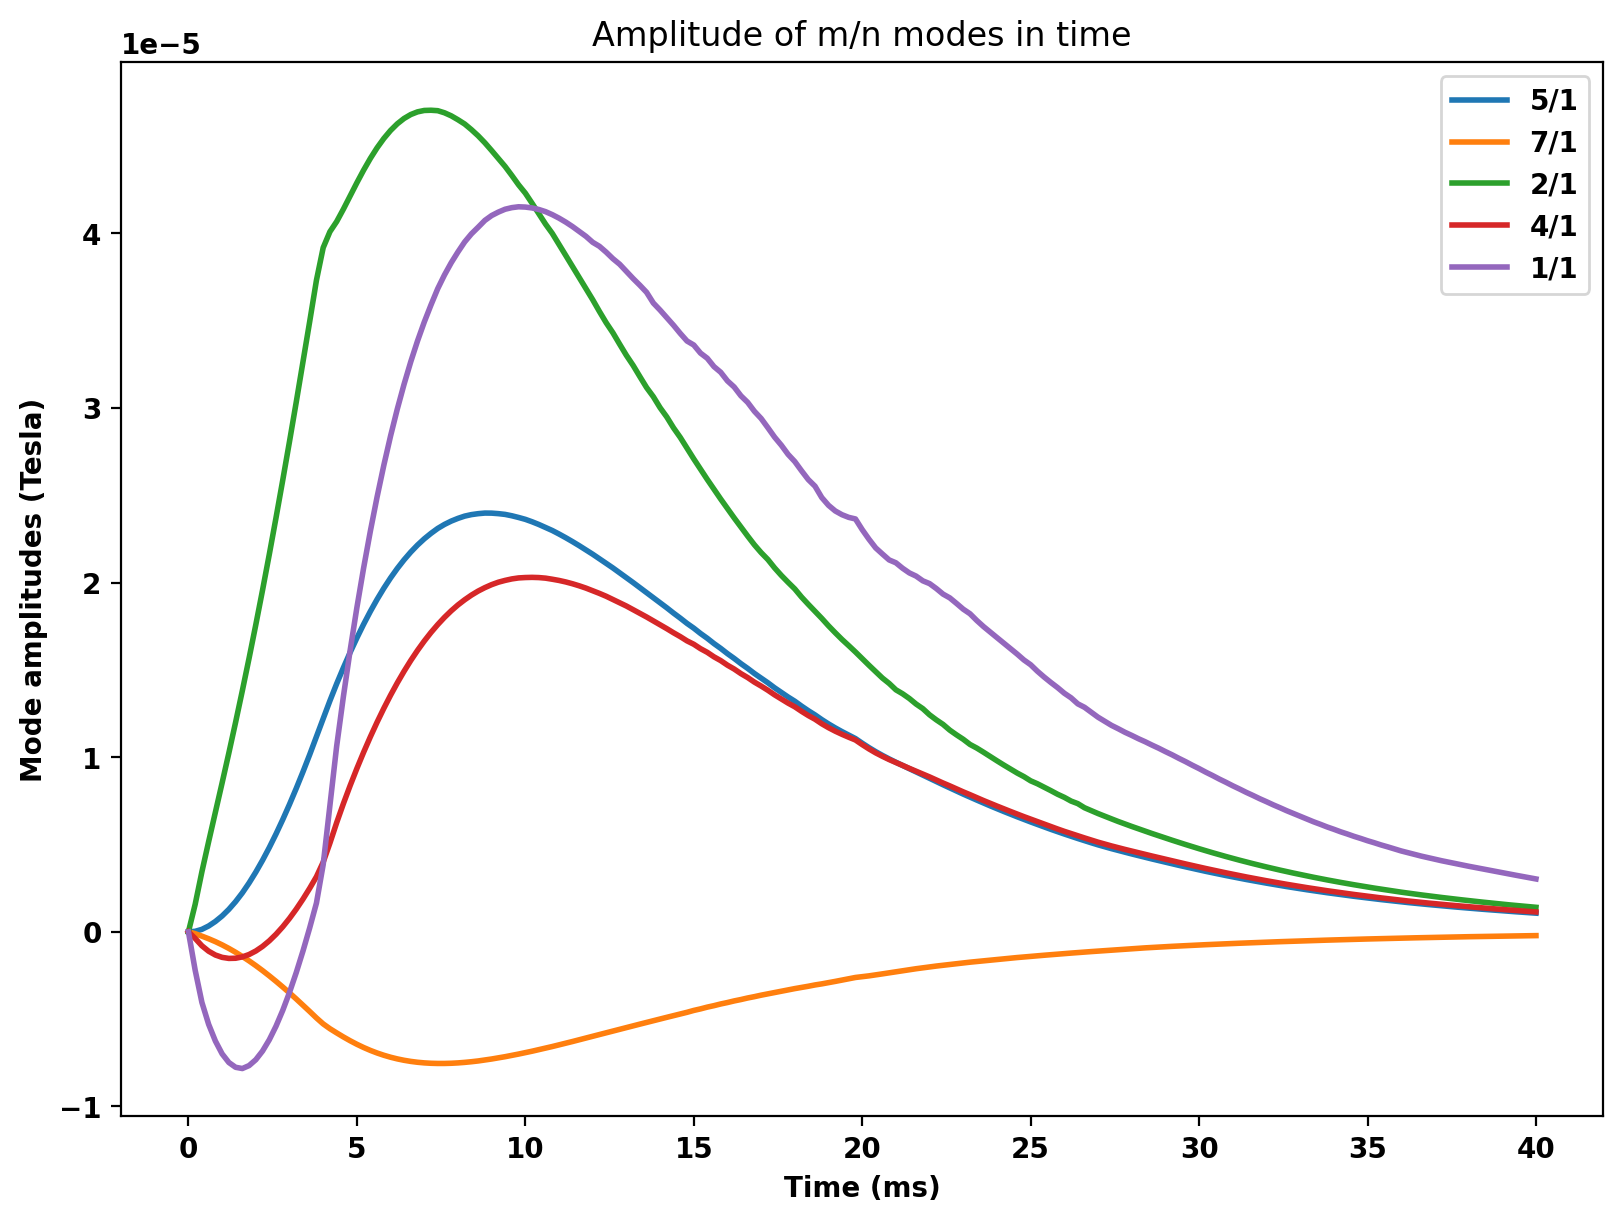
If you followed the coupling procedures (used control surface and hamada_dphi = delta_phi from GPEC), you can run "interface.save_surfmn(t,filename,eliminate_negative_n=True,scale=1e-4,hamada_dphi=None)" to output the normal magneic field's 2D Fourier transform in a SURFMN-formatting file that can be input to GPEC as perturbations on the control surface. In this case, we've masked the driving current filament in oft_in_remc.xml, so the eddy currents in the torus and inductive currents in REMC are the perturbation sources.
 1.17.0